A river runs through it
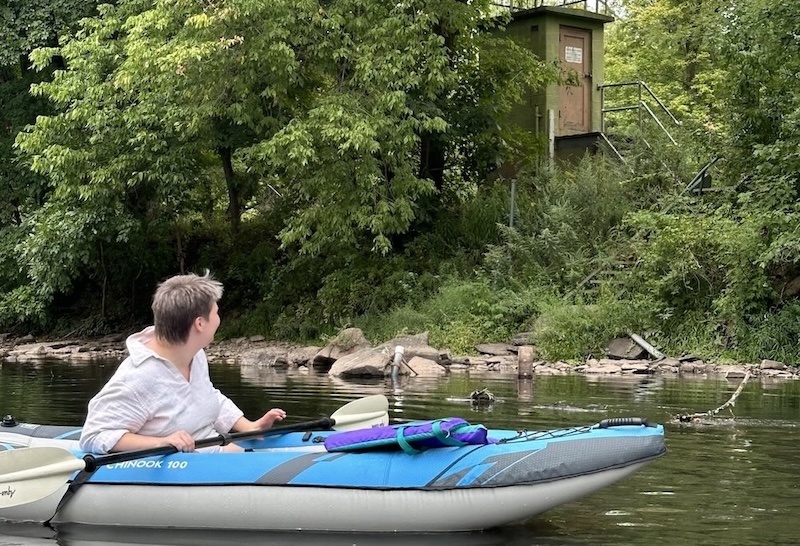
Streamgages (or stream gauges if you prefer) are devices that measure the surface level of a body of water. Gage height is a simple measurement that tells hydrologists a great deal about the state of a watershed, marking both floods and droughts. It’s also of deep interest to boaters, who know that certain streams can only be navigated at certain water levels.
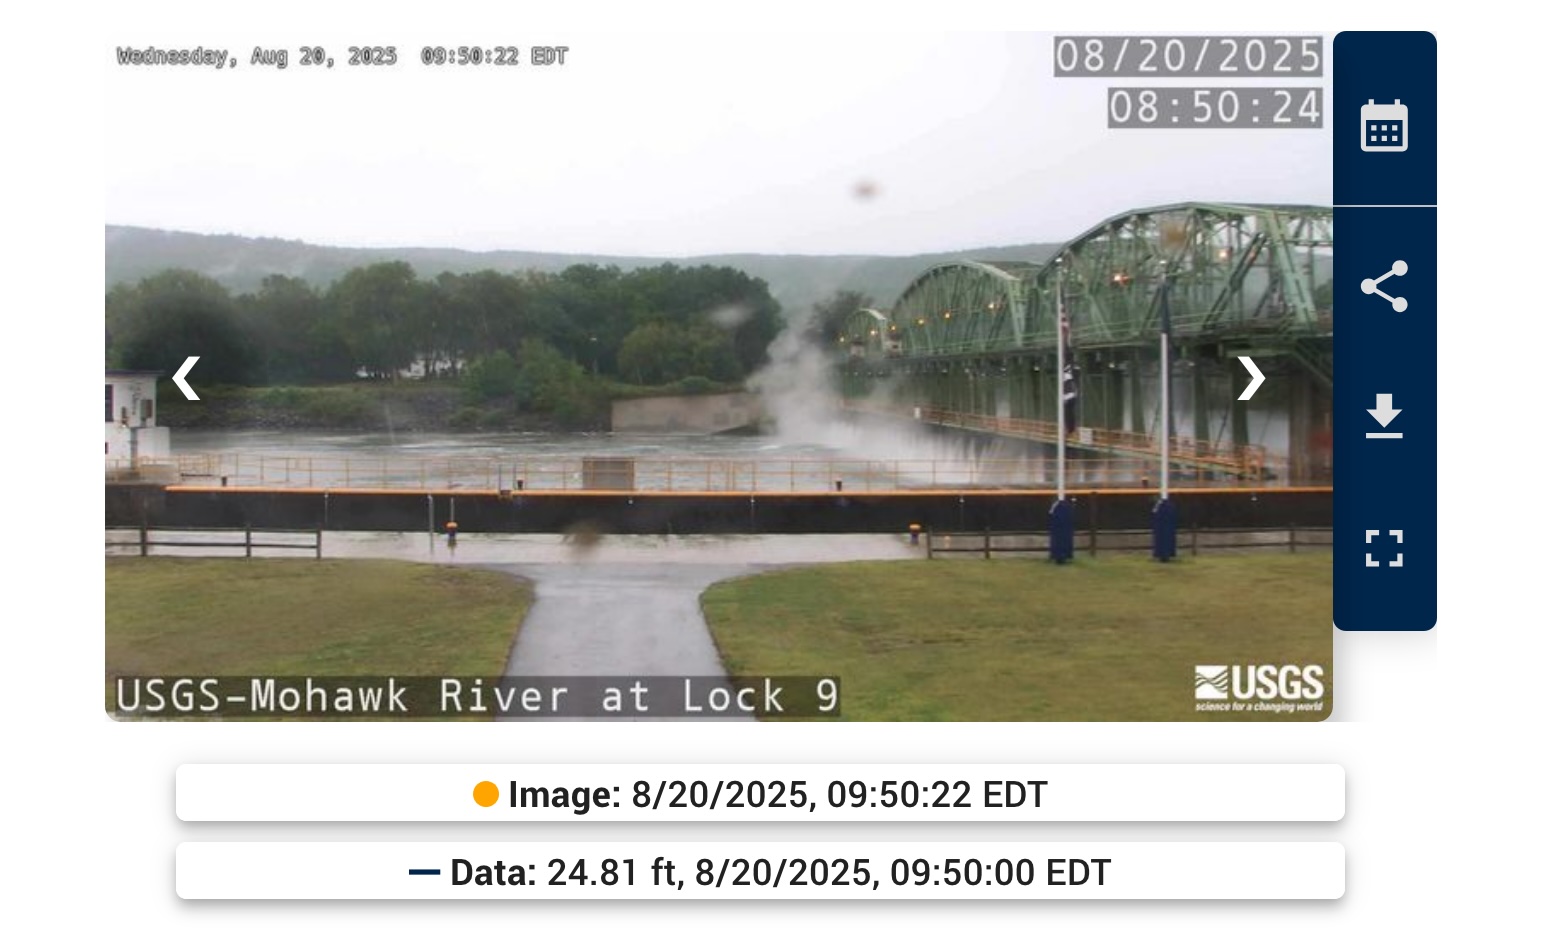
The U.S. Geological Survey maintains an extensive network of streamgages across the United States. Each has a webpage providing the public with valuable real-time waterway data. However, I found the experience a bit siloed. As part of my canoe and kayak trail project, I realized that if the USGS streamgages were included in OpenStreetMap, then apps could link users to current stream conditions. Time to get mapping!
Engaging the gages
I knew it would be infeasible to map all 10,000+ USGS monitoring stations one-by-one, so a data import was in order. It turns out that there is a lot of churn with gages coming online and offline all the time. So instead of doing a one-time import of data that would instantly become stale, I wrote a series of scripts that compare the latest offical data with OSM and generate OsmChange files with updates. This way we can keep the map fresh going forward.

1. Getting source data
The first step in our process is getting the source data. As the product of a federal agency, USGS data is in the public domain and thus license-compatible with OSM. Alas, USGS doesn’t distribute anything like a single GIS file of the gages. Rather, there is an old school API that returns CSV tables of stations actively recording given metrics. Not ideal, but workable.
2. Crosswalking the source data
Next we have to translate, or “crosswalk” the source data into the OpenStreetMap format using standard tags. Regrettably, I find the USGS station names to be poorly formatted for OSM, with many having abbreviations and unexpected capitalization. But after a mix of automated and manual editing, we get objects with tags like this:
man_made=monitoring_station
name=McKenzie River near Vida
official_name=MCKENZIE RIVER NEAR VIDA, OR
ref=14162500
website=https://waterdata.usgs.gov/monitoring-location/14162500
operator=United States Geological Survey
operator:short=USGS
operator:type=government
operator:wikidata=Q193755
ele=260.82
monitoring:water_level=yes
monitoring:flow_rate=yes
monitoring:water_temperature=yes
3. Fetching existing OSM data
It’s a common mistake in OSM to import duplicate features atop existing data. To avoid this, we need to be mindful of whatever gage data lives in OSM already. Luckily, since all USGS stations have unique identifiers, we can simply compare ref tags to avoid creating redundant features.
Before starting this import, I manually went through and added any missing ref and operator tags to USGS stations previously mapped in OSM. This done, we can fetch the latest OSM data with a short Overpass query.
4. Diffing the two datasets
At this stage we have two datasets: the official USGS data with OSM tags, and the downloaded OSM data. Their formats being the same, we can compare them directly and create three types of changes: additions, updates, and deletions. When updating, we don’t want to override everything from OSM, just values where USGS is the source of truth.
5. Uploading to OSM
Our OsmChange files in hand, all we need to do is boot up JOSM, drag in the files, and upload. We can do this in small batches to avoid irking changeset reviewers with massive bounding boxes. For deletions, there are cases when stations haven’t been removed but are temporarily down, so I prefer to review each one manually.
With that, OSM is up-to-date with USGS. We can re-run the scripts anytime we like.
Follow-up work
After completing the initial import, I decided to see how else I could take streamgage mapping even further.
Tagging even more data
USGS monitors a lot more than just water levels, so I expanded the script to support forty-some environmental qualities such as salinity, soil moisture, air pressure, and groundwater discharge. A lot of the sites have webcams, so I added links to those. Most have external identifiers that allow interfacing with providers like NOAA, so I added those through a third-party dataset.
Upgrading USGS geometry
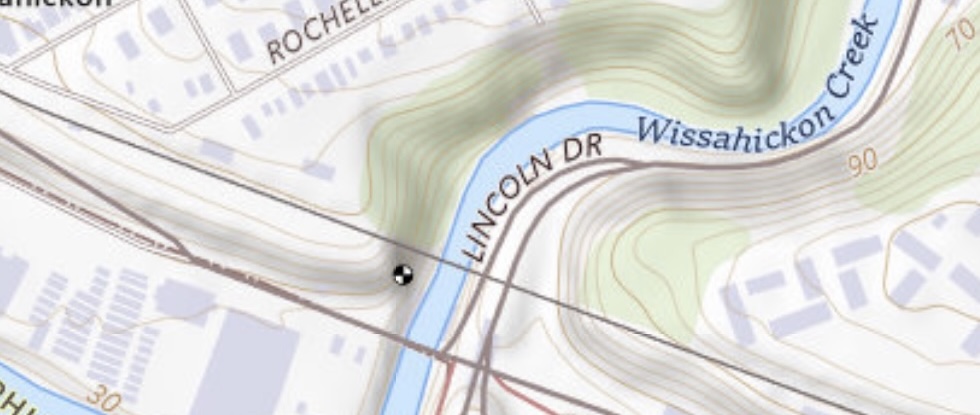
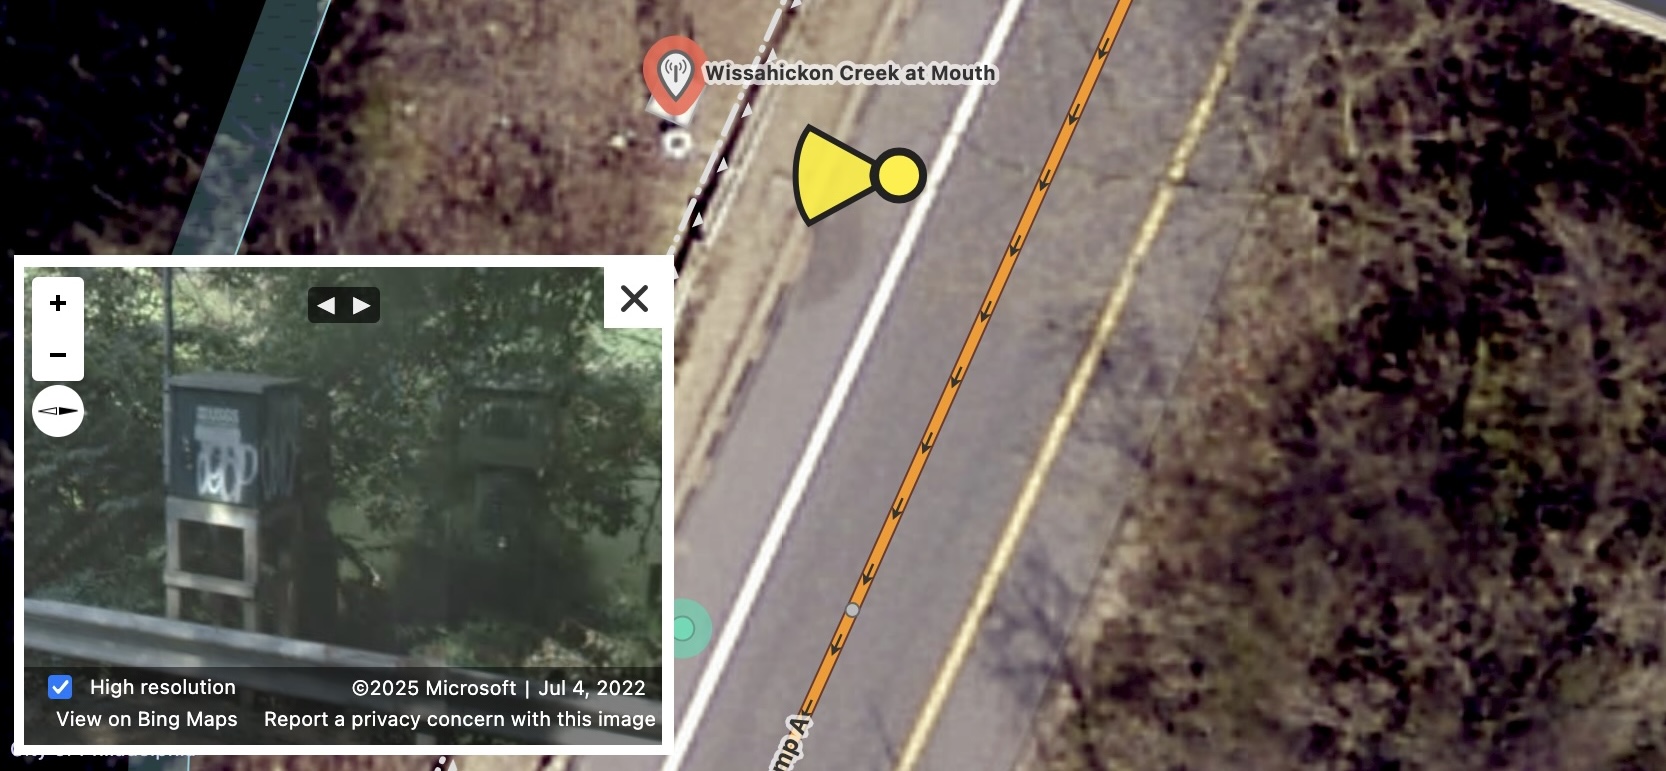
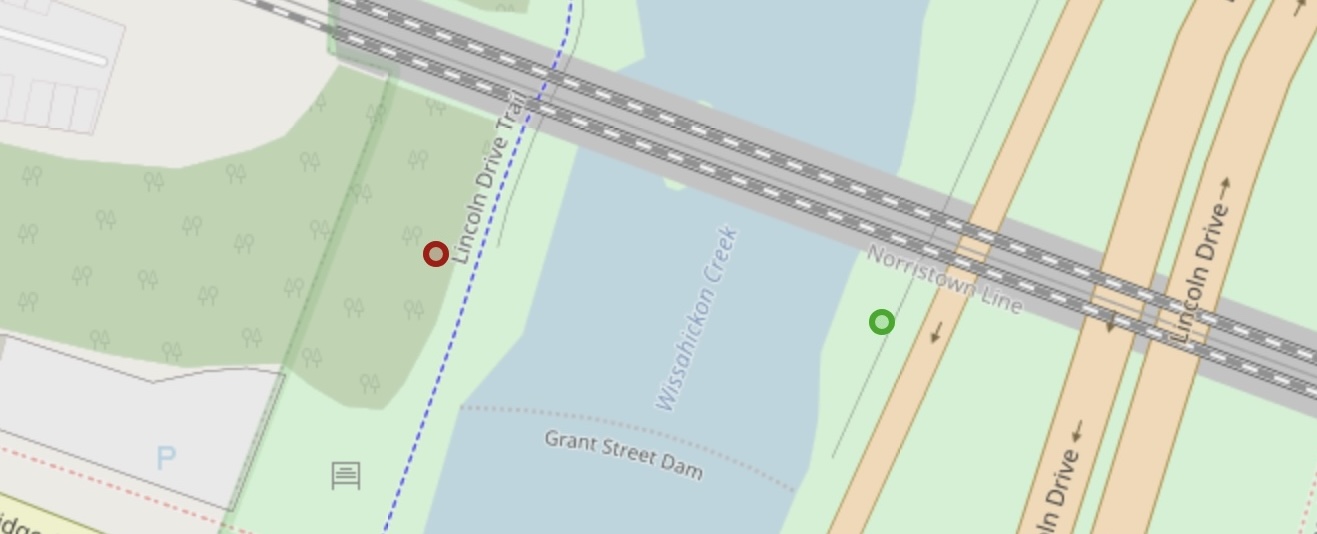
You can do a lot with automated edits, but editing by hand has its own advantages. It turns out that the gage coordinates given by USGS aren’t terribly accurate, erring by as much as a few hundred yards. This may be okay for 1:24,000 scale topo maps, but is wildly substandard for OpenStreetMap.
Since the import, mapper including myself have been improving gage locations in OSM based on aerial imagery, ground-level imagery, and surveys. In effect, this means that OpenStreetMap now has better geometry for USGS monitoring sites than does USGS. Go figure.
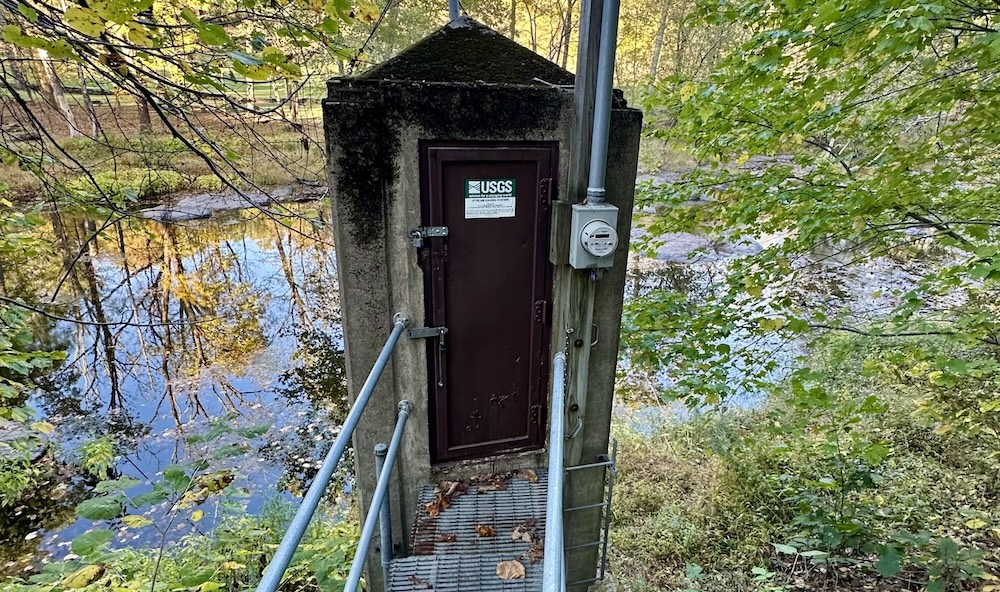
Tagging gagehouses
A gagehouse is a special little building that shelters gaging equipment. OpenStreetMap didn’t have a tag specifically for this, so I started using building=gauge_house (the British spelling), drawn as an area around the monitoring station node. I wrote up documentation for this tag so other mappers can discover it.
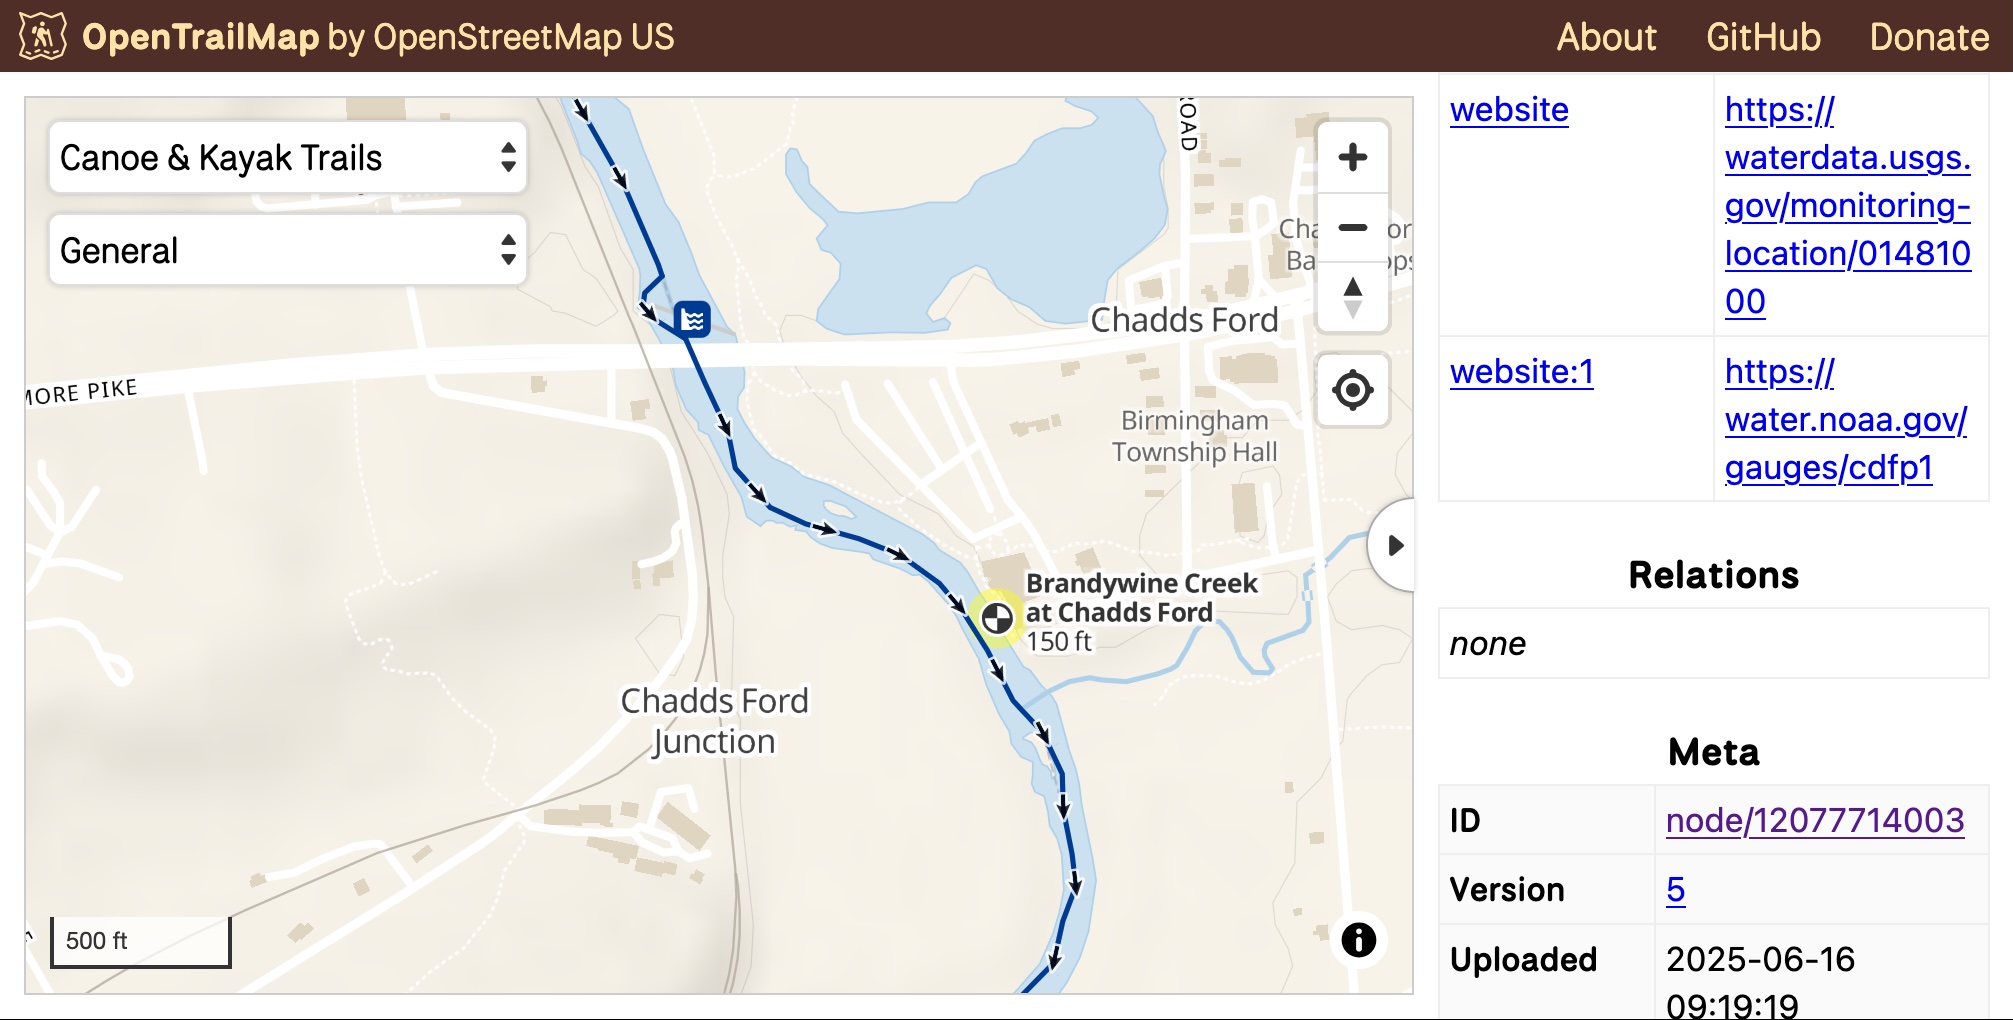
Visualizing gages
Having already developed the Canoe & Kayak Trails view for OpenTrailMap, it was a natural fit to include streamgages. For the icon, I directly copied the pinwheel that has been used to mark gages on USGS topographic maps for decades. Users can easily view each station’s OSM tags and check its current conditions through external links.
Reflections and future directions
In the end, I imported more than 16,000 USGS features into OSM that monitor surface water, groundwater, weather, soil, and snowpack.
Unusually for OSM imports, I did this without raising red flags from other mappers. The work was highly technical and time-intensive, involving a number of custom scripts and a fair amount of gruntwork. Most people do not have this level of expertise when trying to get their data into OSM. But the result was an accurate, comprehensive merging of data that would have taken over a thousand hours if completed manually.
I published my work as open source in the hope that other people could adapt it to their own use cases. I myself have already adapted it to import NOAA’s tide gagues and Philadelphia’s bikeshare stations. Eventually I’d like to build out a reusable framework and library of third-party datasets to keep in sync with OSM.
Don’t hestitate to reach out if you have questions or need help with your own import.
